NBA Hackathon Submission
After the Golden State Warriors acquired former MVP Kevin Durant in 2016, some NBA fans speculated that the Warriors would not lose consecutive games at any point of the season.
a) If you wanted to determine the probability that this prediction would be true (i.e., that the Warriors would never lose consecutive games at any point during an 82-game season), what is one approach (or a few approaches) you may use to solve the problem? What answer do you get? Exact answers are of course welcome, but approaches that lead to approximations (and those approximations) are fine, too (please specify the precision of your estimate). Assume the Warriors have an 80% chance of winning each individual game.
Simulation Approach:
Each simulation is 100,000 seasons. I then did 100 simulations (to back in to the precision).
# 1 game Simulation

def game_win(win_prob):
    rand = random.random()
    if rand > win_prob:
        return False
    else:
        return True
# 1 simulation ( n trials)

def sim(seasons, win_prob, games):
    # keep track of seasons w/ 2 consec losses
    consec_loss_seasons = 0

    for s in range(seasons):
        consec_losses = 0
        for g in range(games):
            if game_win(win_prob):
                # reset
                consec_losses = 0
            else:
                consec_losses += 1

            # eval consec_losses
            if consec_losses == 2:
                consec_loss_seasons += 1
                break

    return consec_loss_seasons
import random
import matplotlib.pyplot as plt
import scipy.stats as st
import numpy as np

sims = 100
results = []
seasons = 100000
win_prob = 0.8
games = 82

print('Progress Bar:')

for s in range(sims):
    results.append(sim(seasons, win_prob, games))

    # progress bar
    if s % 10 == 0:
        print('\n' + str(s) + '% ', end = '')
    print('#', end = '')
Progress Bar:

0% ##########
10% ##########
20% ##########
30% ##########
40% ##########
50% ##########
60% ##########
70% ##########
80% ##########
90% ##########
Precision Calculation
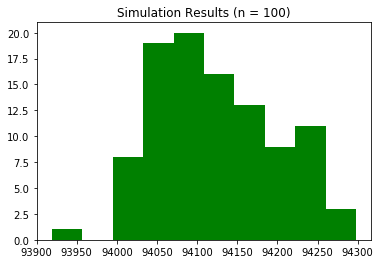
plt.hist(results, color='g')
plt.title('Simulation Results (n = 100)')

plt.show()
# Calculate Confidence Intervals

results_np = np.array(results)

conf_95 = st.norm.interval(0.95, loc=results_np.mean(), scale=results_np.std() )
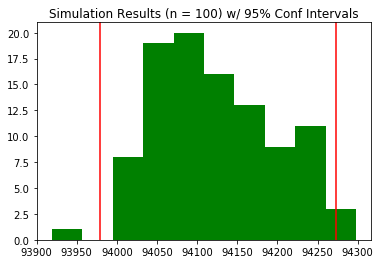
plt.hist(results, color='g')
plt.title('Simulation Results (n = 100) w/ 95% Conf Intervals')

plt.axvline(conf_95[0], color='r')
plt.axvline(conf_95[1], color='r')


plt.show()

print('Mean: ' + str(round(results_np.mean(), 2)) )
print('95% Confidence Interval: ' + str(round(conf_95[0], 2)) + ' -> ' + str(round(conf_95[1], 2)) )

percent_precision = str(round((results_np.mean() - conf_95[0]) / results_np.mean(), 5 ) )
print('This means that the precision of 1 simulation (100,000 seasons) is ~' + percent_precision + '%')
print('Note: The precision will be affected when the percent chance of winning 1 game is changed')
Mean: 94125.97
95% Confidence Interval: 93979.57 -> 94272.37
This means that the precision of 1 simulation (100,000 seasons) is ~0.00156%
Note: The precision will be affected when the percent chance of winning 1 game is changed
b) So, would you have agreed with that hypothesis?
Because the percent chance of having consecutive losses in a season is ~ 94%, I would not have agreed with that hypothesis.
c) Finally, at least what % of a team’s games would a team need to be expected to win (assuming that win probability stays constant from game to game) for there to be a greater than 50% chance that the team never suffers consecutive losses at any point in the season?
Same simulation approach as before, but with different win_probs:
# start at 0.8 and go up until prob of consec loss < 50

first_below_50 = [-1, -1]

start_prob = 0.8
num_steps = 100
step = (1 - start_prob) / num_steps

win_prob_list = []
prob_consec_loss_list = []

count = 0
for prob in np.arange(start_prob, 1, step):
    win_prob_list.append(prob)
    sim(seasons, prob, games)
    prob_consec_loss =  sim(seasons, prob, games) / seasons
    prob_consec_loss_list.append(prob_consec_loss)

    if prob_consec_loss < 0.5 and first_below_50[0] == -1:
        first_below_50[0] = prob
        first_below_50[1] = prob_consec_loss

    # progress bar
    if count % 10 == 0:
        print('\n' + str(count) + '% ', end = '')
    print('#', end = '')
    count += 1
0% ##########
10% ##########
20% ##########
30% ##########
40% ##########
50% ##########
60% ##########
70% ##########
80% ##########
90% ##########
plt.plot(win_prob_list, prob_consec_loss_list, color='b')
plt.axvline(first_below_50[0], color='r')
#plt.axhline(first_below_50[1], color='r')

plt.ylabel('Prob of Consecutive Losses (%)')
plt.xlabel('Win Probability')


plt.show()

print('To have at least a 50% chance of no consecutive losses, the win probability would need to be at least ' + str(round(first_below_50[0], 4)) )
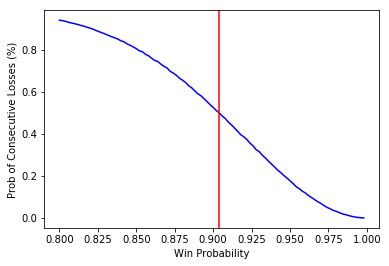
To have at least a 50% chance of no consecutive losses, the win probability would need to be at least 0.904